
SB Energy IPO: DDScore 45 and the Cost of Delivering AI Infrastructure
SB Energy's long-term contracts address a growing need for power and data centers. The DDScore report examines the financing, construction and ownership questions behind that opportunity.
Published September 16, 2026. Analysis dated September 15, 2026.
SB Energy has applied to list on the Nasdaq Global Select Market and Nasdaq Texas under the symbol SBE. The preliminary S-1 leaves the offering price and share count open, so the final terms available to public investors remain to be assessed.
IPO pricing remains open in the analyzed materials. The valuation above $50 billion discussed in the DDScore report comes from public speculation and press reporting cited by the report. It is not a confirmed offering valuation. Any assessment using that figure is conditional: if the IPO valuation exceeds $50 billion, the assumptions about delivery, financing and future cash flow become more demanding, and the associated risks become more consequential for investor returns.
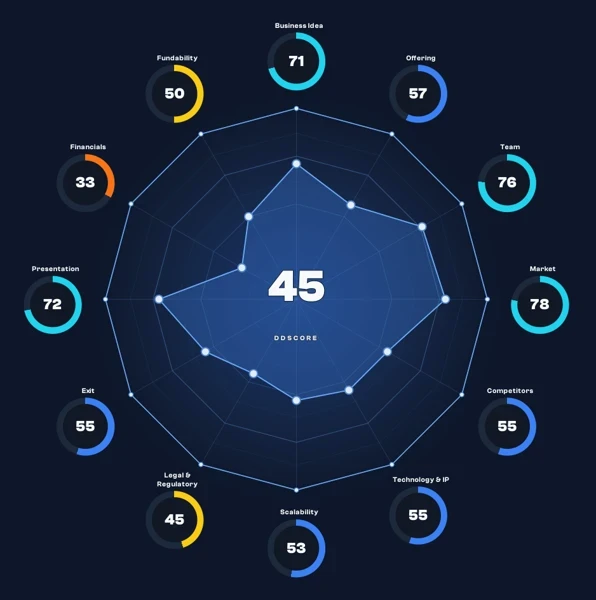
The September 15 DDScore report assigns SB Energy 45/100. Market (78) and team (76) are among its strongest dimensions, while financials (33) and legal and regulatory (45) receive lower scores. This combination points to a substantial commercial opportunity with significant financing and execution demands.
Read the full SB Energy DDScore report
SB Energy, Inc. IPO Analysis
Twelve Dimensions, One Overall DDScore
From Contracted Capacity to Operating Assets
SB Energy combines power infrastructure with data center development. Its S-1 reports approximately 2.2 GWac of operating solar and battery storage capacity as of June 30, 2026. No data center capacity was operating at that date. Cosmos and Milam County were under construction, while PORTS-Pike had an executed lease but had not entered construction as of the prospectus date.
The DDScore report highlights a $439 billion backlog and estimates that approximately 81% falls beyond eight years. That makes the delivery schedule central to the analysis: long-term contracted revenue becomes economically useful only as the underlying projects are financed, completed and brought into service.
The S-1 defines backlog as estimated revenue over the life of executed, binding customer contracts. It also explains that realization depends on assumptions including construction, approvals, interconnection and commissioning. Backlog is therefore a measure of potential future activity, with material conditions attached.
Financing the Buildout
The report identifies approximately $178 billion of backlog-associated capital expenditure. This is an estimated investment requirement across the contracted project program, rather than an amount that must all be raised immediately through common equity.
Project debt, other financing structures and the timing of capital commitments will affect the economics for shareholders. The report gives particular attention to PORTS-Pike's dependence on additional power generation, permits and financing. Cost increases or delays could affect both the timing of revenue and the capital required to reach it.
Reading Revenue Alongside Its Components
The S-1 shows 2025 revenue of $213.5 million, down 8.1% from 2024. Within that total, revenue from customer contracts increased 42.2%, from $100.6 million to $143.0 million, and electricity generation increased 15.5%.
The overall decline reflected lower derivative revenue. Unrealized gains on power price swaps fell by $56.0 million; realized derivative revenue fell by another $5.2 million. These movements more than offset the increase in customer-contract revenue.
The first half of 2026 illustrates the reverse effect. Total revenue increased 66.4% to $138.7 million, while customer-contract revenue declined approximately 5%. Higher derivative revenue drove the overall increase.
Power price swaps are contracts linked to electricity prices. Changes in their estimated fair value can enter reported revenue before the gains are realized. First-half 2026 revenue included $67.4 million of such unrealized gains. These accounting movements help explain why reported revenue growth can differ sharply from growth in customer sales; their inclusion does not by itself indicate improper accounting.
The financing concerns also extend beyond revenue presentation. Operating cash flow was negative $40.0 million in 2025. At the same time, large non-cash charges, including stock-based compensation and, in 2026, warrant remeasurement, mean the reported net loss should not be treated as equivalent to cash consumed. The useful financial questions concern cash generation, project funding and the eventual economics for common shareholders.
These figures show why assessing growth requires separating customer revenue, derivative effects and cash flow. The 2025 figures cover the full year and first-half 2026 figures cover six months.
The open IPO price and share count are limits on what can currently be assessed. Their absence is not itself evidence of weak operating performance. The report's Financials score should therefore be read alongside its underlying findings, with valuation-dependent conclusions kept conditional until offering terms are available.
Partnerships, Concentration and Shareholder Economics
The report recognizes the commercial and financing significance of relationships with SoftBank, OpenAI and NVIDIA. It also highlights concentrated tenant exposure and overlapping customer, ownership and governance relationships.
For prospective shareholders, the questions include how these relationships affect contract terms, future financing and minority influence. The report's discussion of NVIDIA's residual value guaranty concerns protection under specified project arrangements; it should not be interpreted as a guarantee of returns on SB Energy shares.
What to Watch Next
- Final IPO pricing, share count and dilution disclosures.
- Data center completion, readiness and rent commencement milestones, assessed separately.
- Financing and approvals for the largest projects and their supporting power infrastructure.
- Evidence of tenant diversification beyond the current strategic relationships.
- A clearer bridge from project investment and operating performance to cash available to common shareholders.
The report's central question is how successfully SB Energy can turn contracted demand into operating assets on terms that support shareholder returns. The final IPO terms and subsequent delivery milestones will provide important additional evidence.
Explore the full analysis and all 12 dimensions
Sources and Scope
This article summarizes the September 15, 2026 DDScore report. Preliminary S-1 prospectus: SB Energy's preliminary S-1. Listing venues and the proposed symbol are also described in SB Energy's IPO announcement. This is a dated analysis of preliminary materials, not an update on subsequent offering terms.
DDScore provides analytical tooling and scoring to support due diligence. The score is not a price target, a probability of investment success or a recommendation to buy or sell. The report does not replace investor judgment or a full due diligence process.