
In 30 Seconds
- 1.7× is the average of your modeled exits, weighted by probability. 20× lives in the upside.
- Every probability rests on stated reasons. Read them, sort them, and act on the ones you can move.
- Not a promise of 20×. A faster, clearer way to try.
The Idea: Move the Reasons, and the Odds Move
Your expected multiple averages every modeled exit, from failure to breakout. A 20× outcome sits at the top of that range. You don't reach it by nudging the average. You reach it by making the top scenario credible and big enough.
Each probability in your report rests on specific findings. Change the facts behind a finding, and the odds change with it. That used to take weeks of feedback from advisors and investors. Now every reason behind the estimate is readable in minutes.
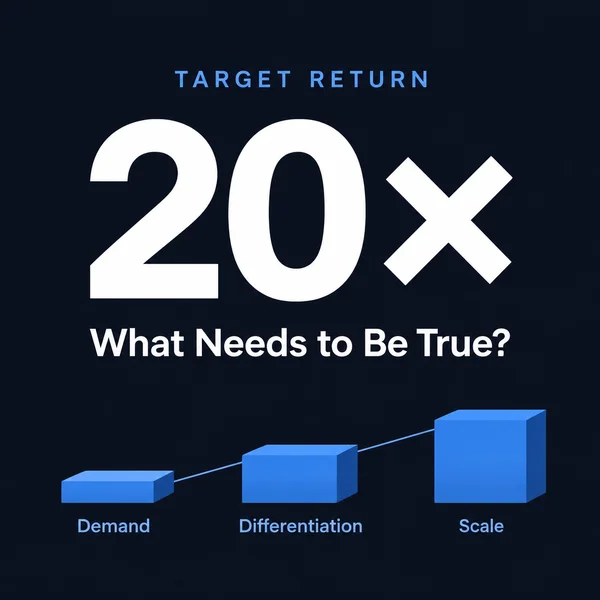
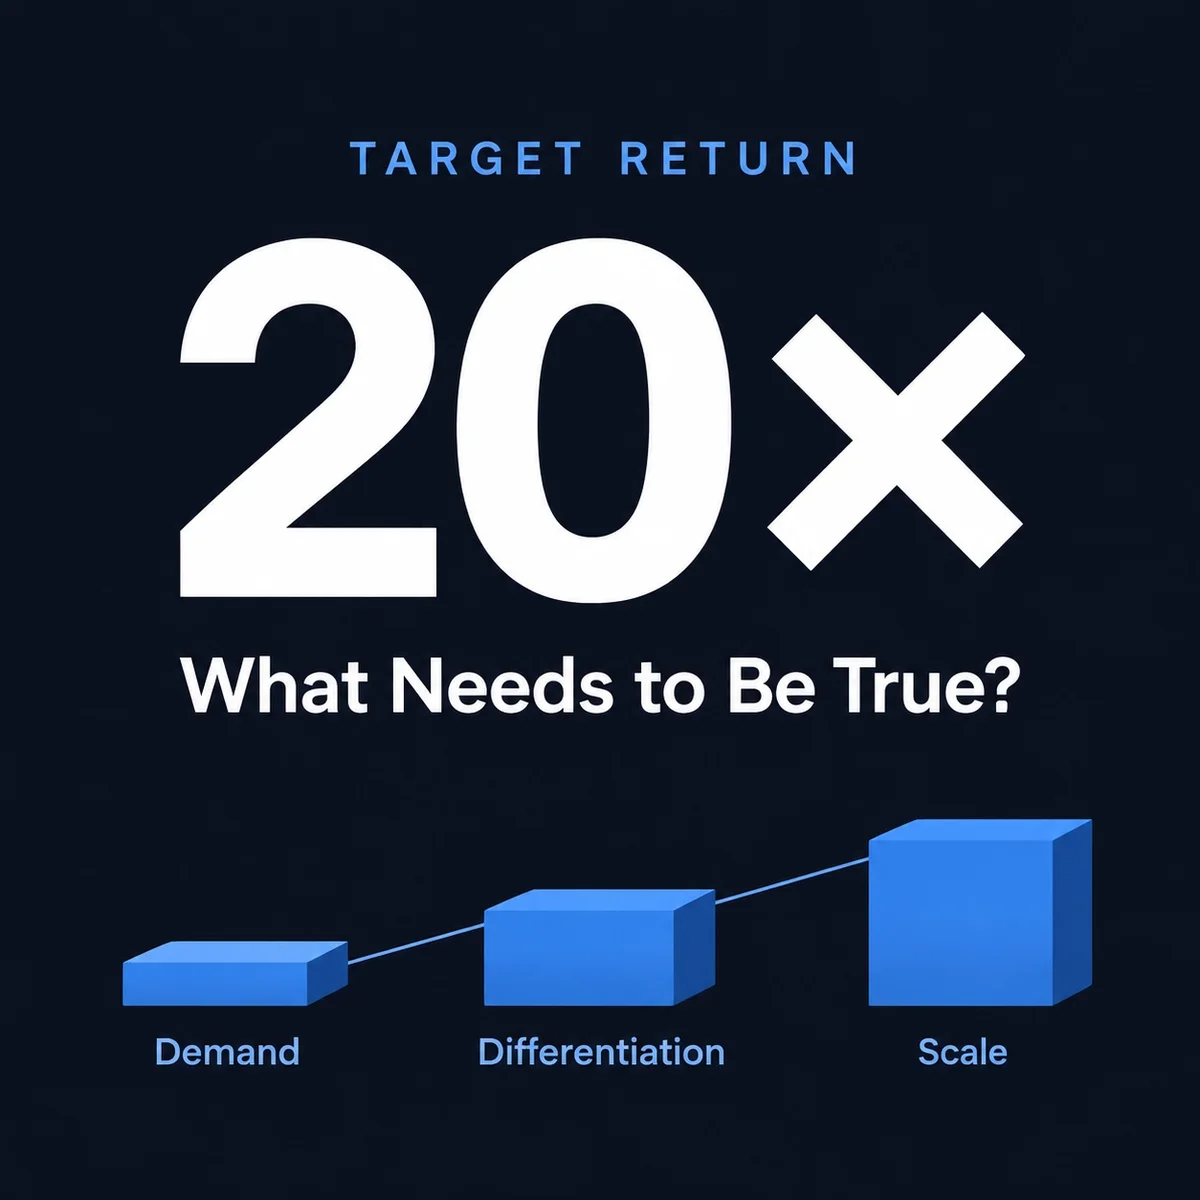
Three things have to be true, in this order:
- Demand: customers want it badly enough to pay.
- Differentiation: you keep winning when competitors respond.
- Scale: you can grow without costs and complexity growing just as fast.
Climbing higher raises the stakes. The analysis shows you where to put your feet.
Investor lens: Investors already think this way. A few exceptional outcomes drive most fund returns, so they look past the average to the size and credibility of your upside.
Step 1: Run Your Analysis and Read Where You Stand
Start with your own report. Read the reasons, not just the number.
- What builds the 1.7×? Each scenario's probability, return range and time horizon.
- What holds it down? The findings in your weakest dimensions, and every risk marked critical or major.
- What does the upside rest on? The assumptions behind your best scenario.
- What context does it assume? Entry valuation, future funding, dilution and time.
Keep the number in proportion. 1.7× means 1.7 times the money back, averaged across scenarios. It is not an annual return or the most likely outcome.
Investor lens: An investor reads the same report next to the probability of losing money and the Range Estimate, the middle half of modeled outcomes. Know those numbers before they ask.

Step 2: Sort Every Finding Into Three
Every finding behind your score falls into one of three groups. Sorting them shows where your effort pays.
| The finding is… | What it means | What you do |
|---|---|---|
| Poorly told | It's handled, but your materials don't show it | Fix the materials |
| Not addressed | The gap is real | Build it into the business |
| Deeper background | There's a reason, and you've stated it | Decide: can you influence it, and is the finding even true? |
You decide which findings to accept, which to act on and which to challenge. The analysis lays out its reasoning so you can argue with it.
Investor lens: Investors want to know which kind of change raised your number. Better materials and a better business are both valuable, but they move the estimate for different reasons. Label them honestly.
Step 3: Define What 20× Requires
Work backward from the outcome, not forward from today.
- Investor ProceedsHow much money must come back?
- Eventual OwnershipWhat stake remains after future financing?
- Exit Equity ValueWhat company value supports those proceeds?
- Business PerformanceWhat revenue, margins and growth support that value?
- Capital and TimeWhat funding and milestones get the business there?
Then test each link against your sorted findings:
- Exit value: does your market support it?
- Performance: which revenue, margins and growth get you there?
- Capital and time: how many rounds, and how much dilution along the way?
If the chain needs incompatible assumptions, change the plan, the price or the target. If it holds, you know what to prove first.
Investor lens: The investor runs the same chain from their side. Will their ownership after future rounds make your breakout matter to the fund?
Step 4: Choose Your Climb
Demand first, then differentiation, then scale. A skipped step usually gets paid for later.
One weak finding rarely stays alone. A long sales cycle shortens your runway, delays hiring and leaves less time to differentiate. Fix the root, and several findings move together.
Example: a hypothetical AI software company overlaps an incumbent's bundled offering. Its forecast assumes premium pricing and little implementation work. The competitor analysis flags both.
| Path A: keep expanding | Path B: go narrow | Path C: go deeper | |
|---|---|---|---|
| Focus | A longer feature list | One workflow where the incumbent performs poorly | The hardest part of the problem, which the incumbent avoids |
| Why buyers pay | Generic features | A measurable reason to pay | Results the bundle can't match |
| Productization | Custom integrations | Repeatable deployment, fewer custom integrations | A smaller product with a much harder core |
| R&D priority | More features | A validated bottleneck, domain-specific reliability, a capability the customer needs | Technology, data or know-how that takes competitors years to copy |
Paths B and C are testable, not proven. Demand, willingness to pay, market size and competitor response still need evidence. Path C also needs more time and capital before customers can confirm the bet.
Investor lens: A narrow entry point earns interest only with a credible path to venture scale. Show the next step after the niche.
Step 5: Turn Each Move Into an Evidence Checkpoint
Tie every spend to a question and a decision rule. Each checkpoint has five parts:
- Question: what are we testing?
- Evidence: what result would answer it?
- Threshold: what level justifies the next step?
- Owner: who runs it?
- Review date: when do we decide?
In the example above: paid deployments in the chosen segment, delivered within a set engineering budget, with proof that customers value the capability. Agree in advance what means scale, revise or stop.
Investor lens: Checkpoints give investors something better than a forecast: a defined moment to see the result and decide.
Step 6: Re-run and Compare the Reasons
After real progress, run the analysis again. Then compare why the number changed, not only how much.
A new multiple can reflect:
- New customer evidence
- Clearer materials
- A revised valuation
- Different financing needs
- External developments
- Changes in the model itself
If the findings that hold you down moved, you're climbing. If only the wording changed, the case got clearer. That's worth doing too, but it's a different gain.
Investor lens: A higher second number alone doesn't prove progress. Investors will ask which findings moved, and what evidence moved them.
What the Investor Decides
Your climb ends in one of three investor calls. Know which one you're aiming for.
| Decision | When it fits | What it means for you |
|---|---|---|
| Stop | The upside doesn't fit their strategy at this price, or an obstacle has no plausible fix | Ask for the specific reason. It's your next finding. |
| Investigate | The upside could matter, but a few assumptions need diligence | Have evidence ready for exactly those assumptions |
| Revisit after evidence | The case could work after a defined milestone | Agree the milestone, then come back with it |
A good "no" is specific. "The round can't fund the validation needed before the next raise" is a finding you can act on. "The score is too low" is not.
Start Climbing
If you don't climb, you won't fall. You won't reach 20× either. The analysis shows you where to put your feet.
Want a Closer Look?
Explore a full report, from key findings to detailed analysis.
Explore the Analysis ReportDDScore provides model-based estimates and structured analysis to support your judgment. It does not provide investment advice, guarantee returns or replace due diligence.